Overview
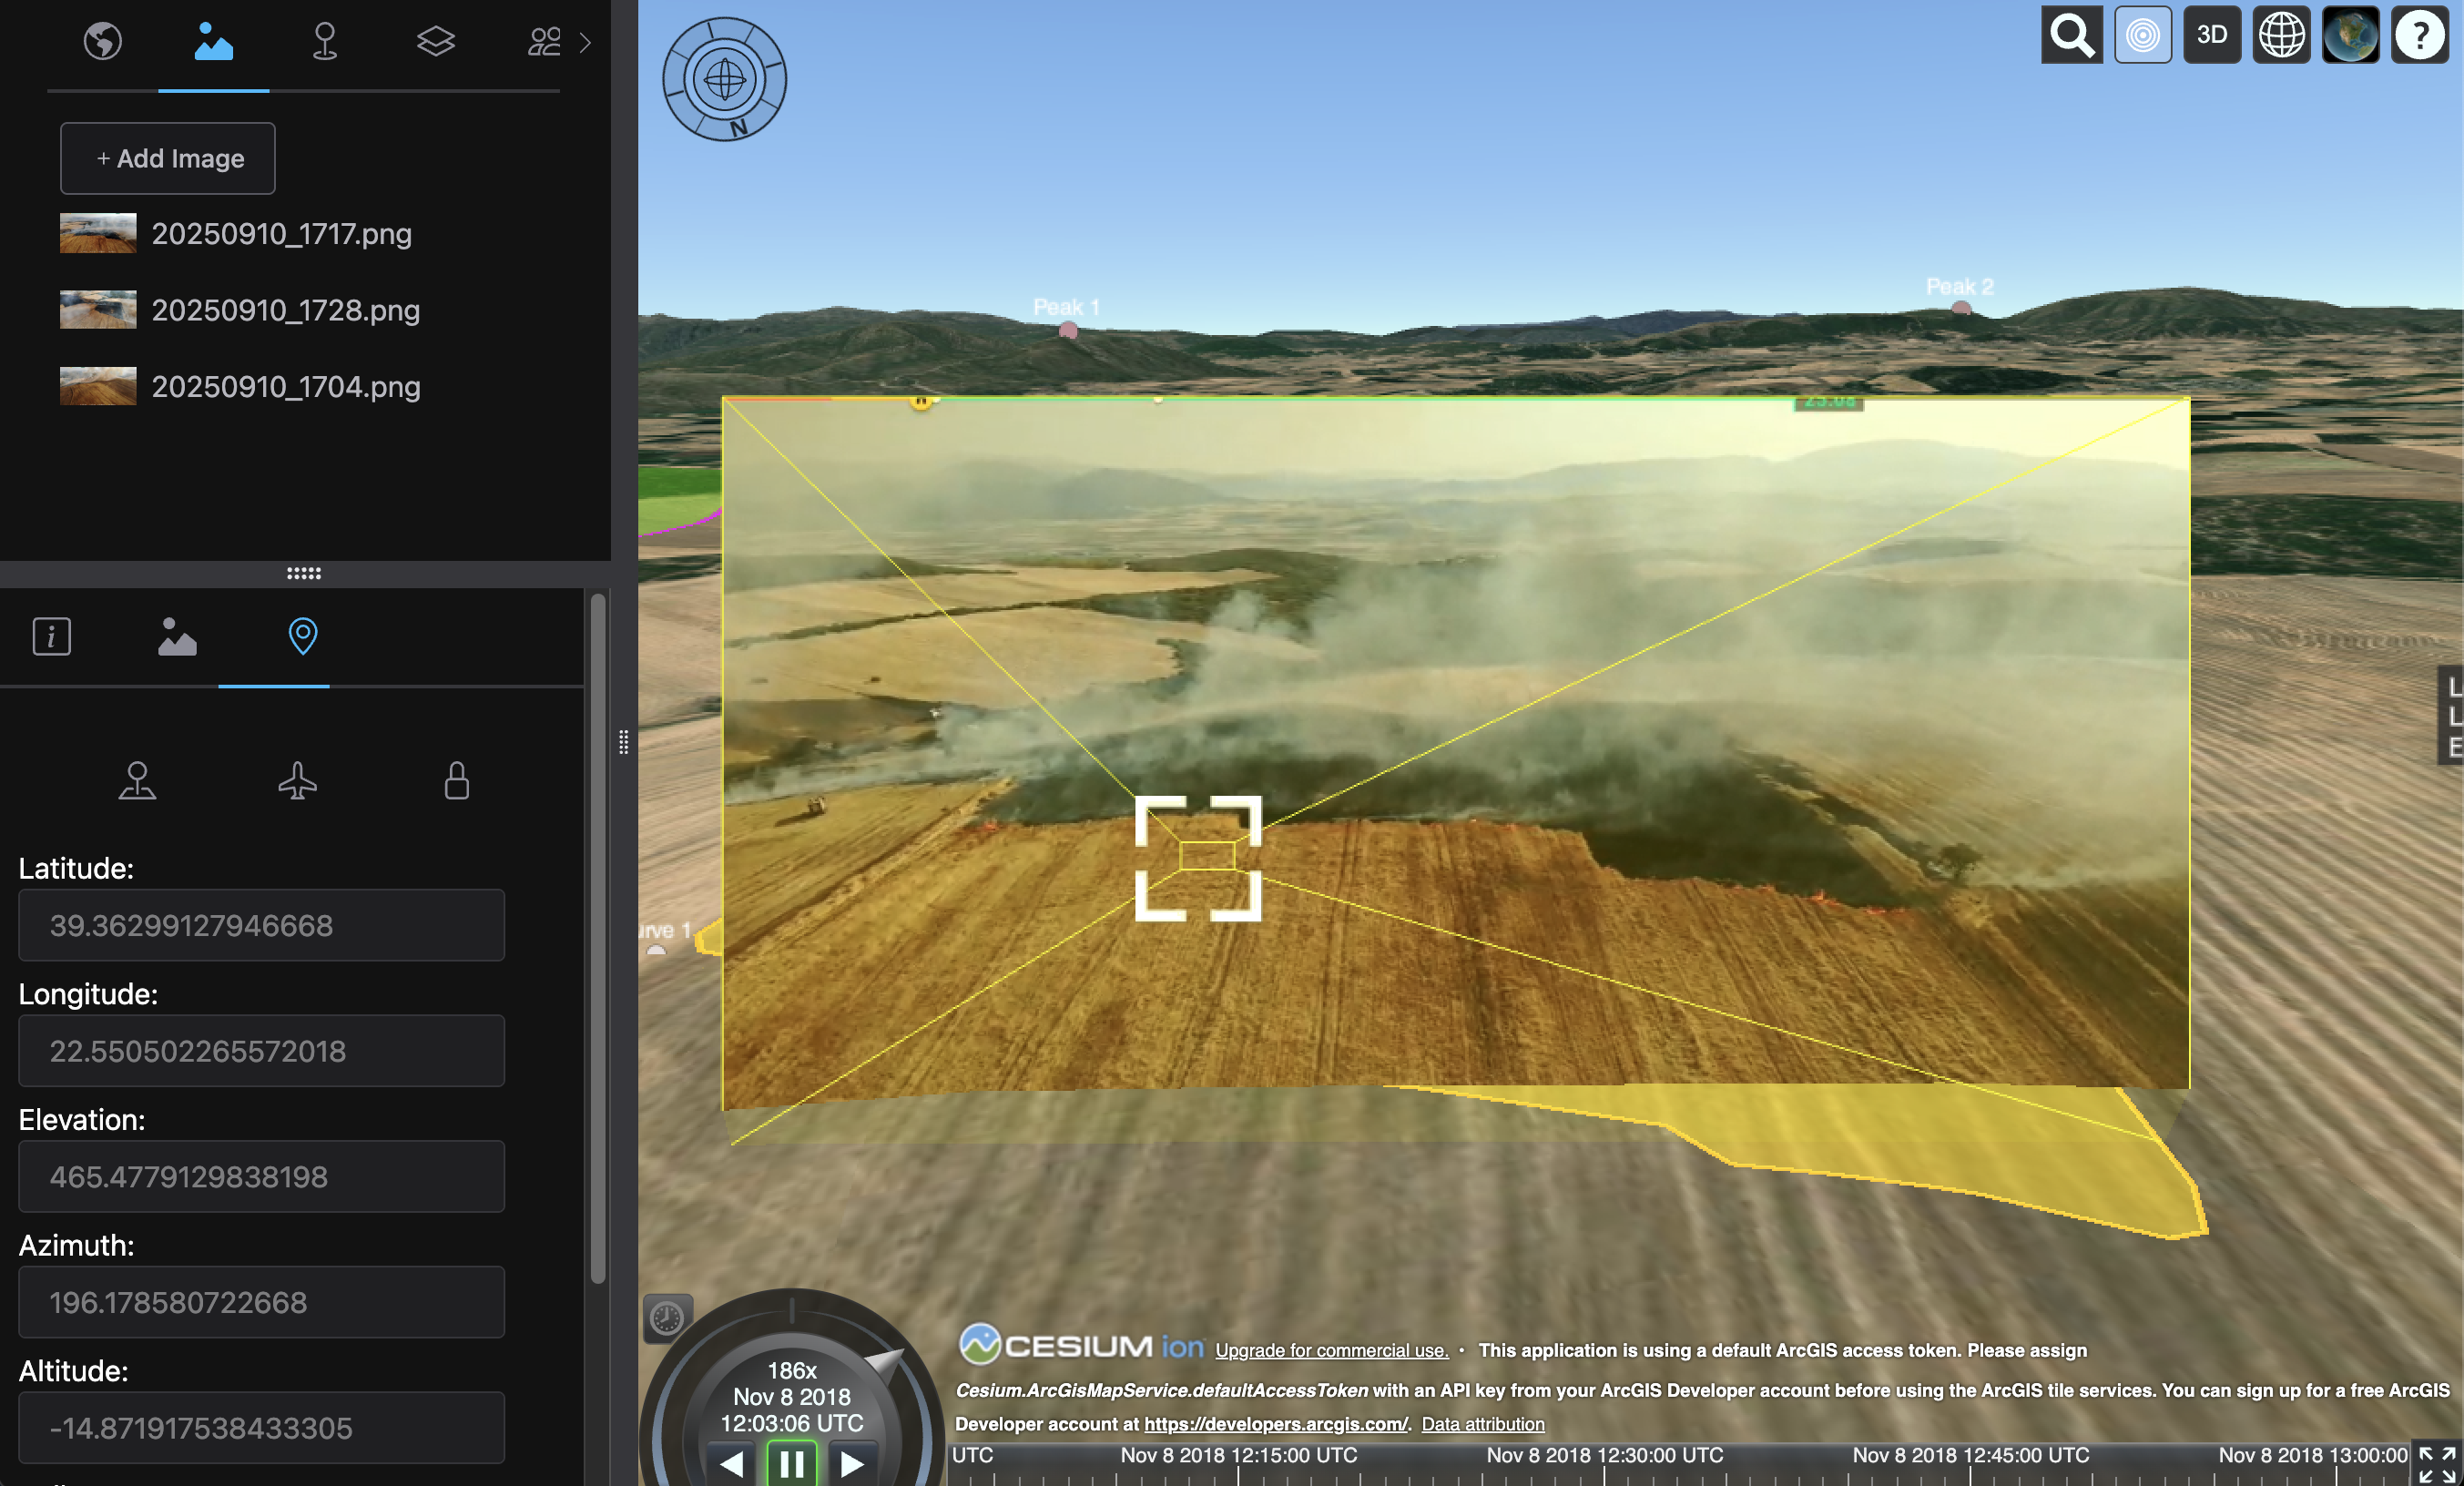
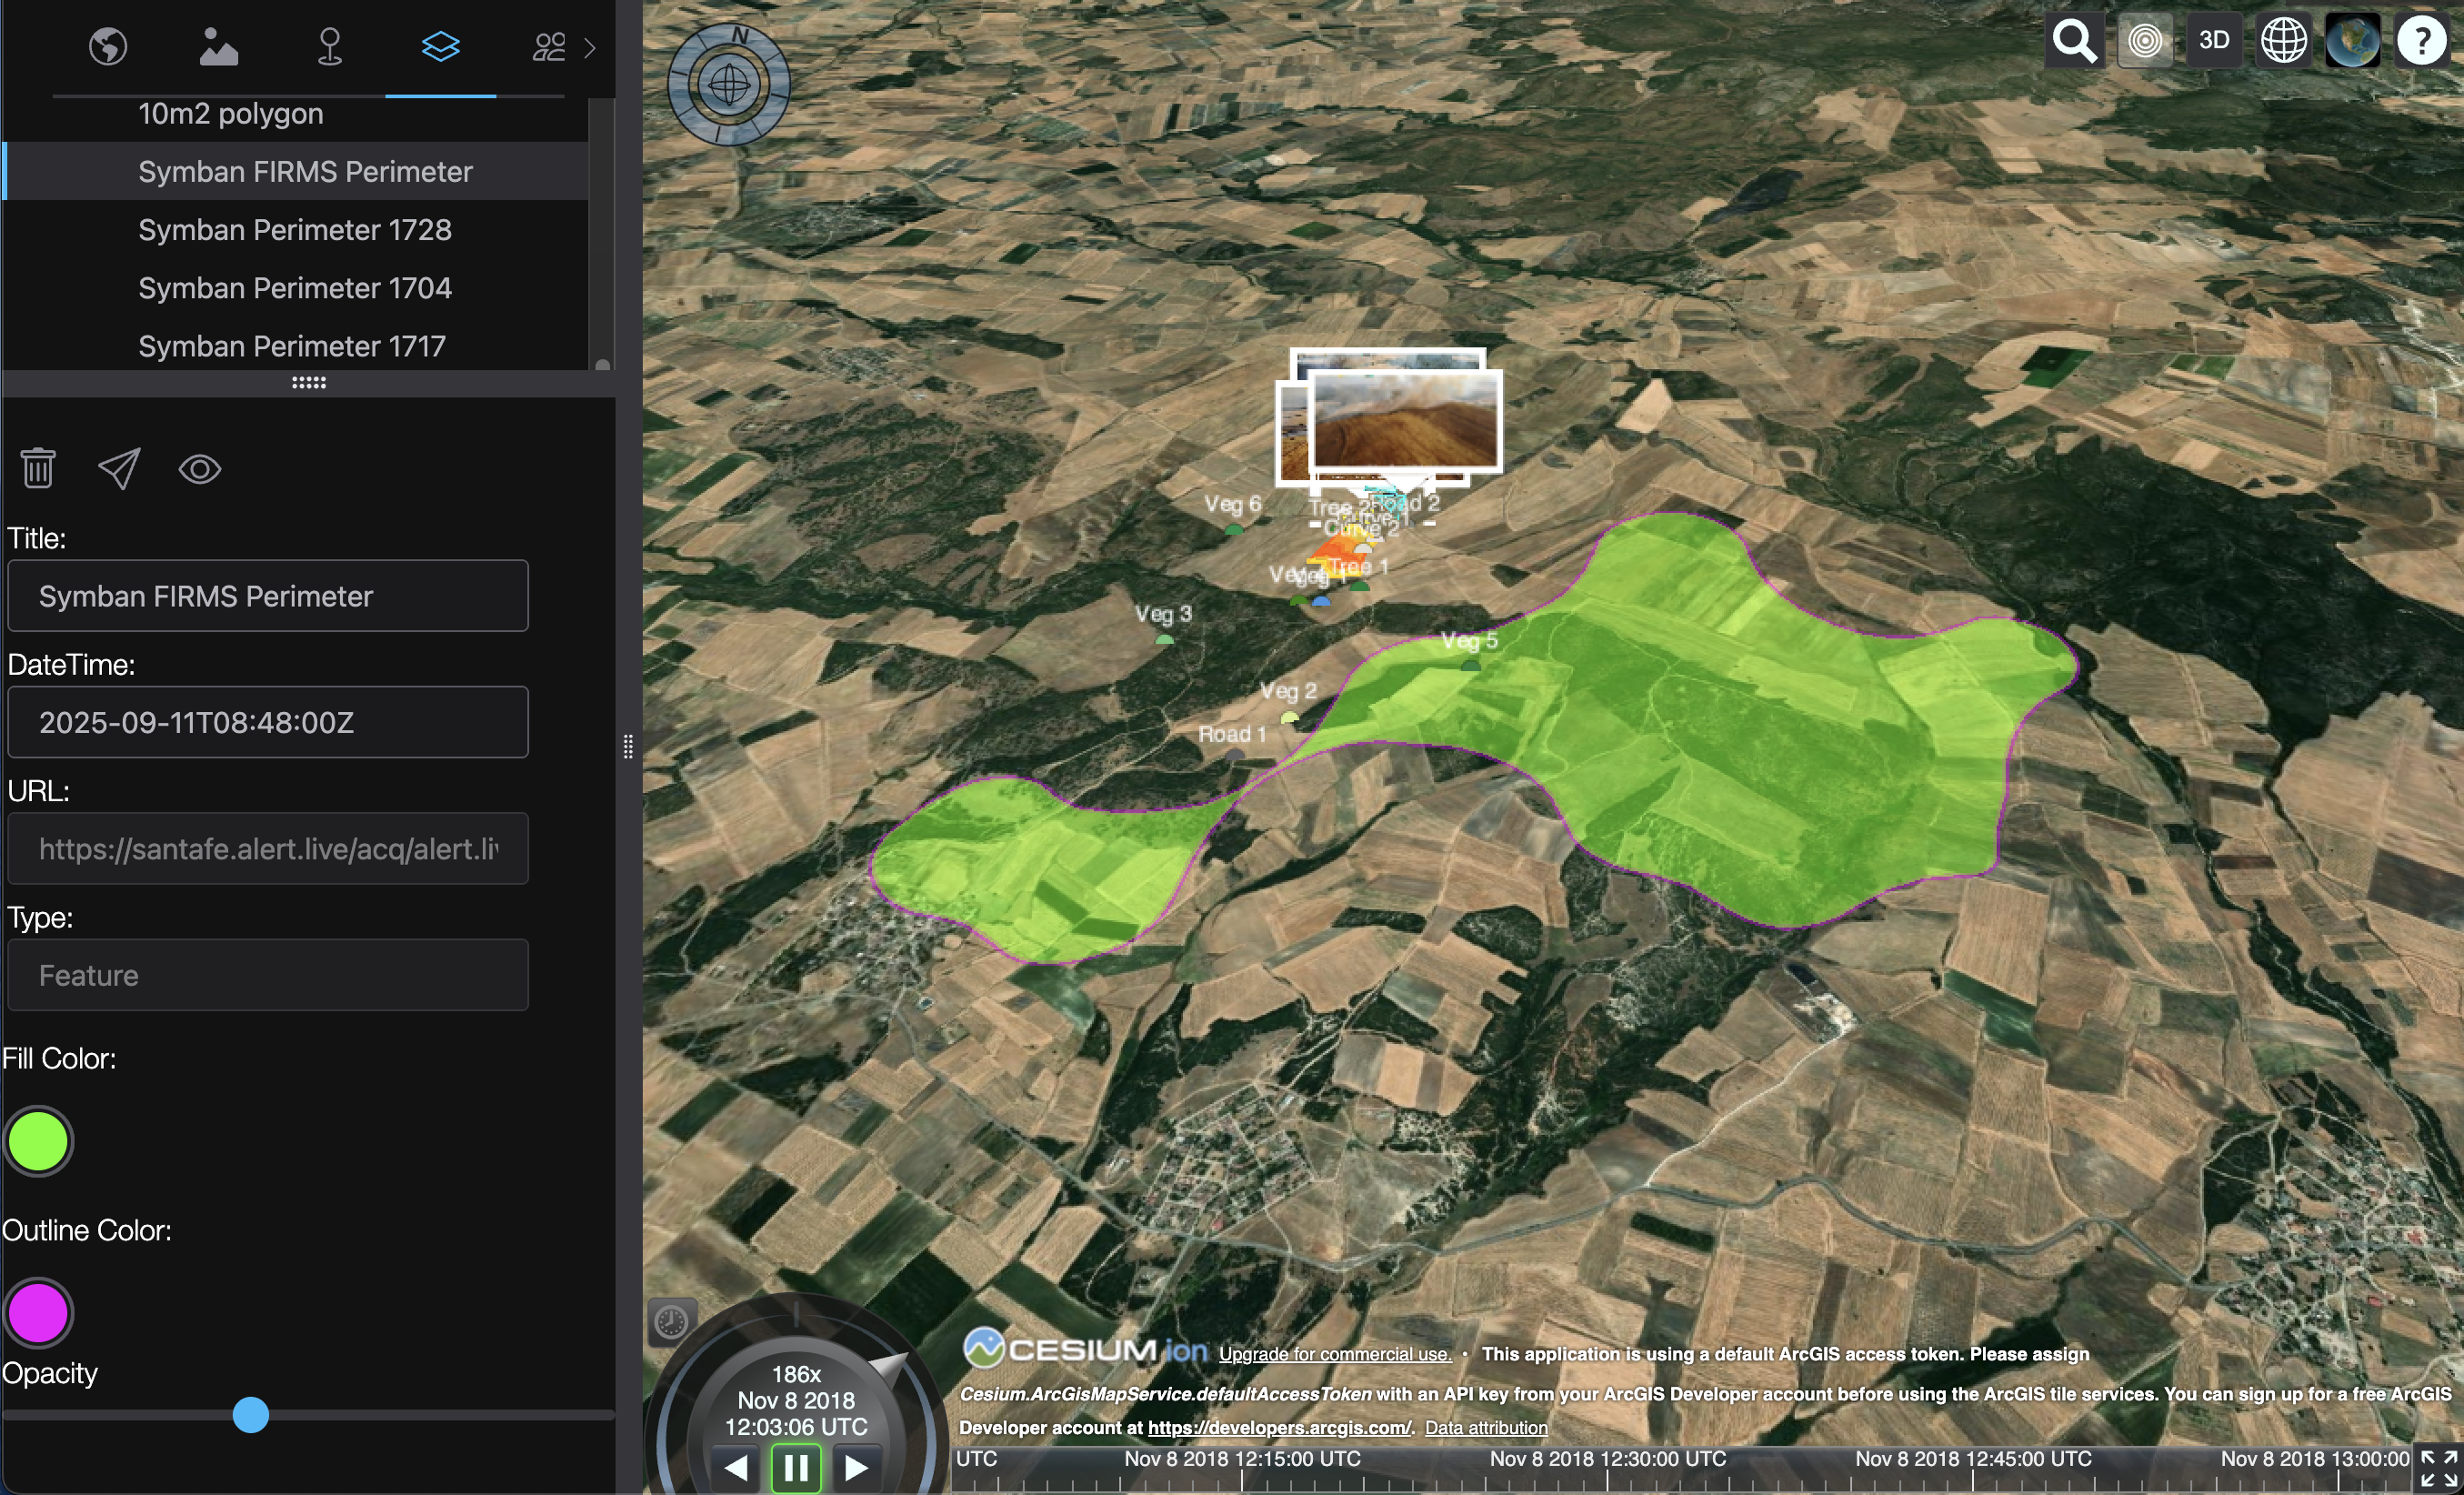
The Cesium-based Event Viewer is a platform that orients two-dimensional imagery inside of Cesium's three-dimensional model of the globe. This brings a new perspective to GIS work, where everyday, civilian-captured imagery can be used to understand fire perimeters, glacial retreat, flooding events, and more, without the seven-figure overhead of collecting satellite imagery. This platform also brings in raster and vector layers for further data analysis.
Technologies / Tools
- CesiumJS
- STAC
- Lit, Shoelace Components and Immer
My role
My work in Event Viewer has had two main threads:
- Working on the main UI, which is built with Shoelace Components, Lit (for lifecycle management), and Immer for immutable state updates. I have built panels that display image/event information to edit/view asset information, enable flyTo functionality, and write information in a JSON structure to a WebDAV database.
- Importing GeoJSON, KML, and GPX vector layers into Event Viewer. CesiumJS natively supports vector layers, but draping functionality is not yet built into the platform. To get the vectors to drape, I created a custom fragment shader that finds the elevation of each point on the globe (above the WGS84 Ellipsoid) from Cesium’s terrain provider and applies that to the geometry primitive for the layer. The Event Viewer platform creates STAC items for each layer added to it. I utilized the flexibility of the STAC data structure to add a renders object, which contains outline color, fill color, and opacity properties to persist layer styling across applications.